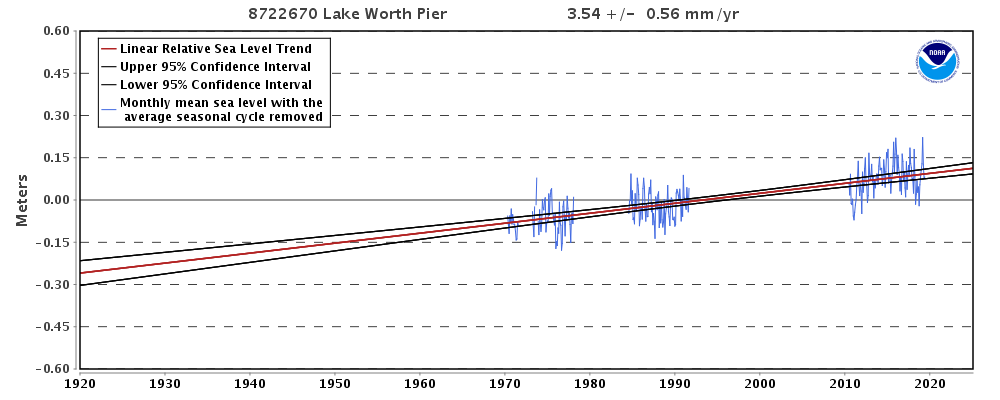
Now this is fascinating. I was just doing a blog post on correlation between the finished floor elevation of my house in North Palm Beach and basically when the forecast storm surge is such that I should be worried. In looking at the NOAA web site for the Lake Worth Pier and I found a plot that shows the MEASURED change in sea level since that station began reporting data. What I saw there astounded me.
CLICK HERE to see the trends of all the tide monitoring stations of NOAA.

“The plot shows the monthly mean sea level without the regular seasonal fluctuations due to coastal ocean temperatures, salinities, winds, atmospheric pressures, and ocean currents. The long-term linear trend is also shown, including its 95% confidence interval.”
“The relative sea level trend is 3.54 millimeters/year with a 95% confidence interval of +/- 0.56 mm/yr based on monthly mean sea level data from 1970 to 2018 which is equivalent to a change of 1.16 feet in 100 years.”
THIS GRAPH OF THE ACTUAL RECORDED SEA LEVEL AT THE LAKE WORTH PIER SHOWS THAT THE SEA LEVEL HAS RISEN THERE BY OVER 1′ IN JUST THE LAST 100 YEARS. (Note the graph is in Meters.) I would expect this to be similar to places along the coast such as Jupiter, Singer Island and Jupiter Island to be very similar.
I happen to live in a neighborhood that has pretty decent elevation BUT after looking at this I would NOT buy property between Indiantown road and the river for instance. This land is already low, the location along the river makes it susceptible to storm surge, and after seeing this trend this is going to get worse in the not too distant future.


