5 April 2023 – UPDATE NOAA just released the official report on Hurrican Ian.
This report notes: “The NOS tide gauge near downtown Fort Myers measured 7.26 ft above MHHW”. Further south: “Elsewhere, maximum inundation levels of 9 to 13 ft AGL occurred on the eastern portion of Sanibel Island.”” The graph below shows the raw data from this station by the NAVD 88 datum where MHHW is 0.28′ by the NAVD 88 datum. Note though that in their math (a 7′ storm surge) they do NOT take into account that tides at that station had been runing about 1′ above normal. This is the difference between the red and blue line on the graph below. I say it was a 6′ surge but they call it 7′. Why?
It is because, according to NOAA, “Storm surge is defined as the abnormal rise of water generated by a storm, over and above the normal astronomical tide, and is expressed in terms of height above predicted or expected tide levels.”
I’ve done a few Blog posting on sea level rise, king tides around Jupiter and how to calculate how a predicted storm surge relates to the elevation of your house. I went to the NOAA site where I get data for some of these and looked at the tide station data. WOW!
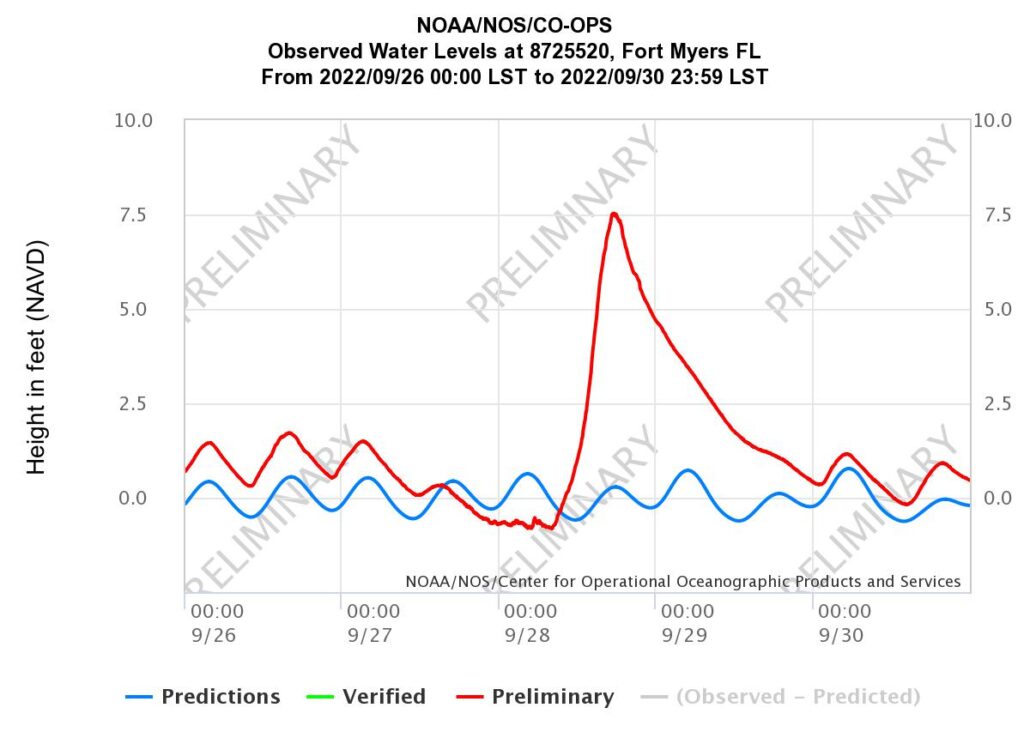
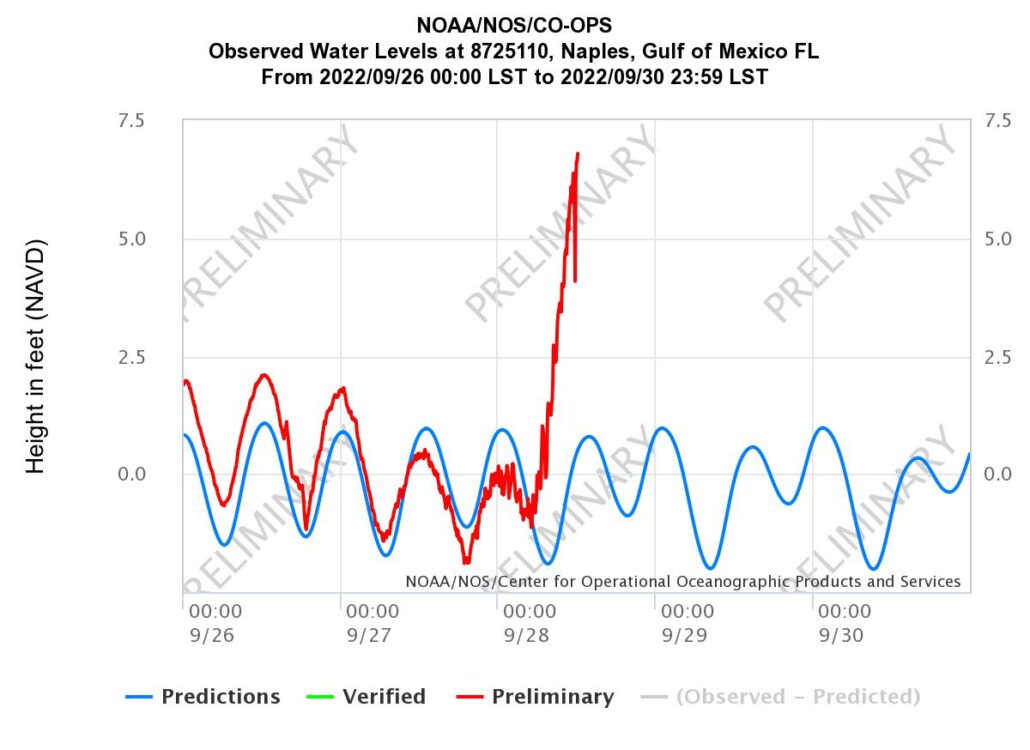
Note that the Naples tide gauge broke during the storm. Now as I mentioned in a previous post, storm surge is the water ABOVE what was expected that day, and the tides had been running a bit higher, about 1′, than normal due the cycle of the moon, which we see in the chart above as the difference between the red and blue line in the days leading up tot he storm.
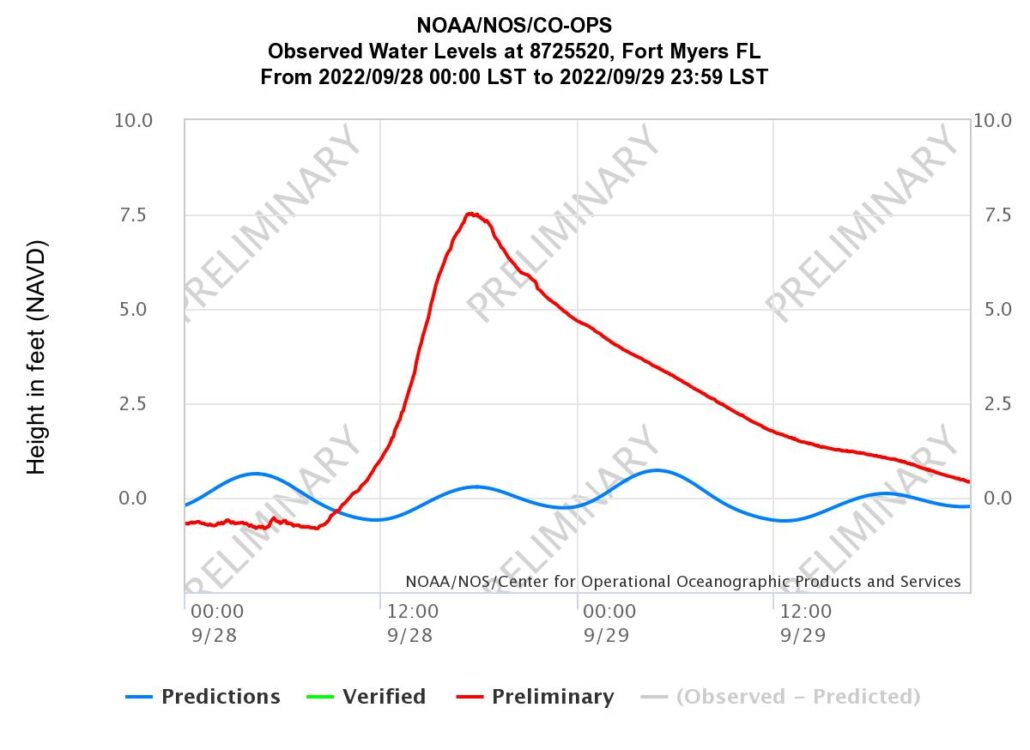

So, what was the measured storm surge? It looks like from the graphs above that it was ABOUT a 7′ (7.5′ NAVD -0.5′) ‘storm surge’ in Fort Meyers where the gauge is located up in the bay at the City of Fort Meyers Yacht Basin. Note that it took a full 24 hours for all that water to go back into the ocean and to return to a normal tide cycle in Fort Meyers.
The Naples gauge is (was) located on the Naples Pier and went off line at about noon time on Wednesday the the 28th with a little over a 5′ surge recorded AT THAT TIME. BUT, looking more closely at this data we see that the Fort Meyers gauge recorded a maximum water level at about +17 (5PM) on the 28th. I’m outside my proverbial lane here but looking at the slope of the graph prior to station failure and assuming that the maximum surge height occurred ABOUT the same time as Fort Meyers (2 BIG assumptions) we should add another 5′ onto this last reading. I would thua ESTIMATE that the storm surge at the Naples Pier was about 10′, with a water level of about +11′ NAVD.
And, this does not include the wave action, BUT it is measuring the water level at the gauge, salt or fresh.
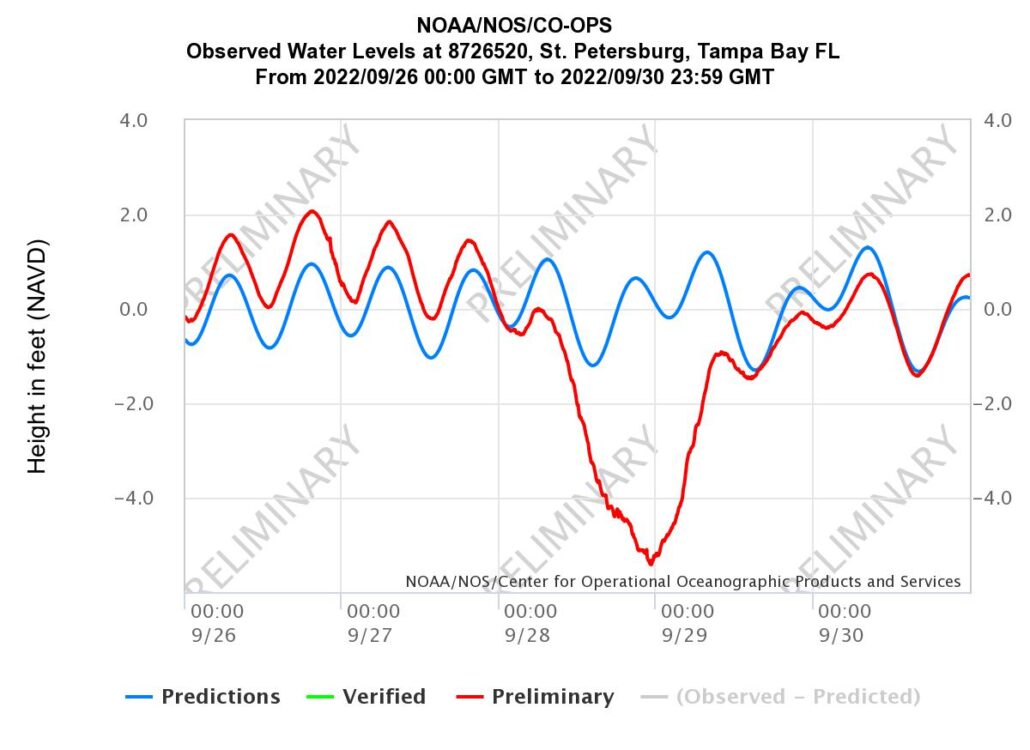
Further up the coast in St Petersburg the water was going in the other direction…
